User Guide
This guide explains how to navigate the RA Knowledge & Docking Platform, explore the Knowledge Base, create docking jobs, and inspect output, analytics, and plot results.
-
This is the homepage of the Rheumatoid Arthritis Knowledge & Docking Platform (RA-KDP). It provides an overview of the platform and introduces its main functions. Click RA Workspace in the top navigation bar to enter the main workspace.

-
After clicking RA Workspace, you will enter the workspace page. This page presents the two core modules of the platform: Protein KnowledgeBase and Protein-Ligand Docking Analysis.

-
Click the Protein KnowledgeBase card to enter the Knowledge Base workspace. Here you can browse curated RA-related protein targets, explore structured protein records, and continue to the search and results view.

-
Click the Protein-Ligand Docking Analysis card to enter the docking workspace. This is the main page for creating docking jobs, submitting molecules, and selecting docking targets.
-
Step 1. Search and browse RA targets.
In the Knowledge Base, you can search targets by protein name, gene symbol, UniProt ID, or tag. The results can be viewed in either Card view or Table view, and category filters help you quickly narrow the target list.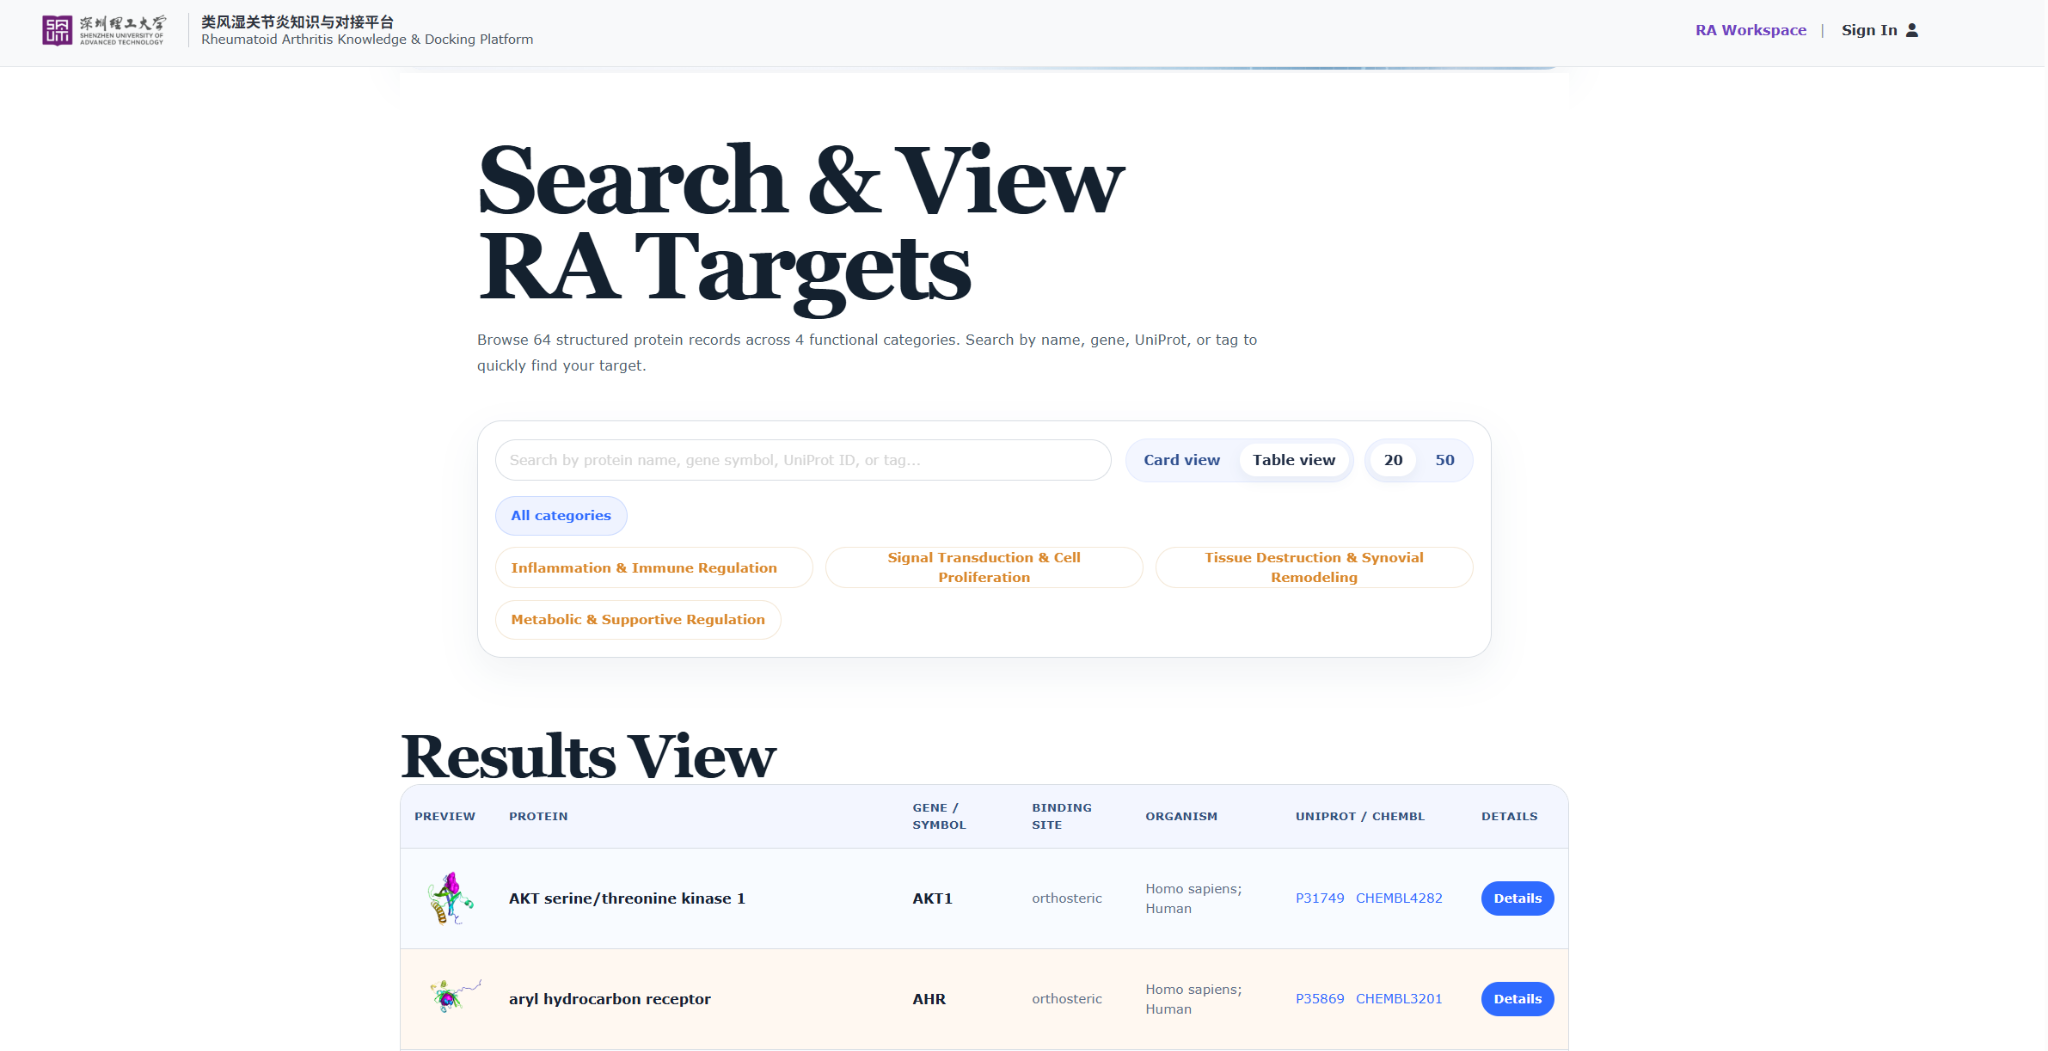
-
Step 2. Open the target details page.
Click Details for any target to open its details page. This page provides structural visualization, external resource links, and downloadable model files for further inspection.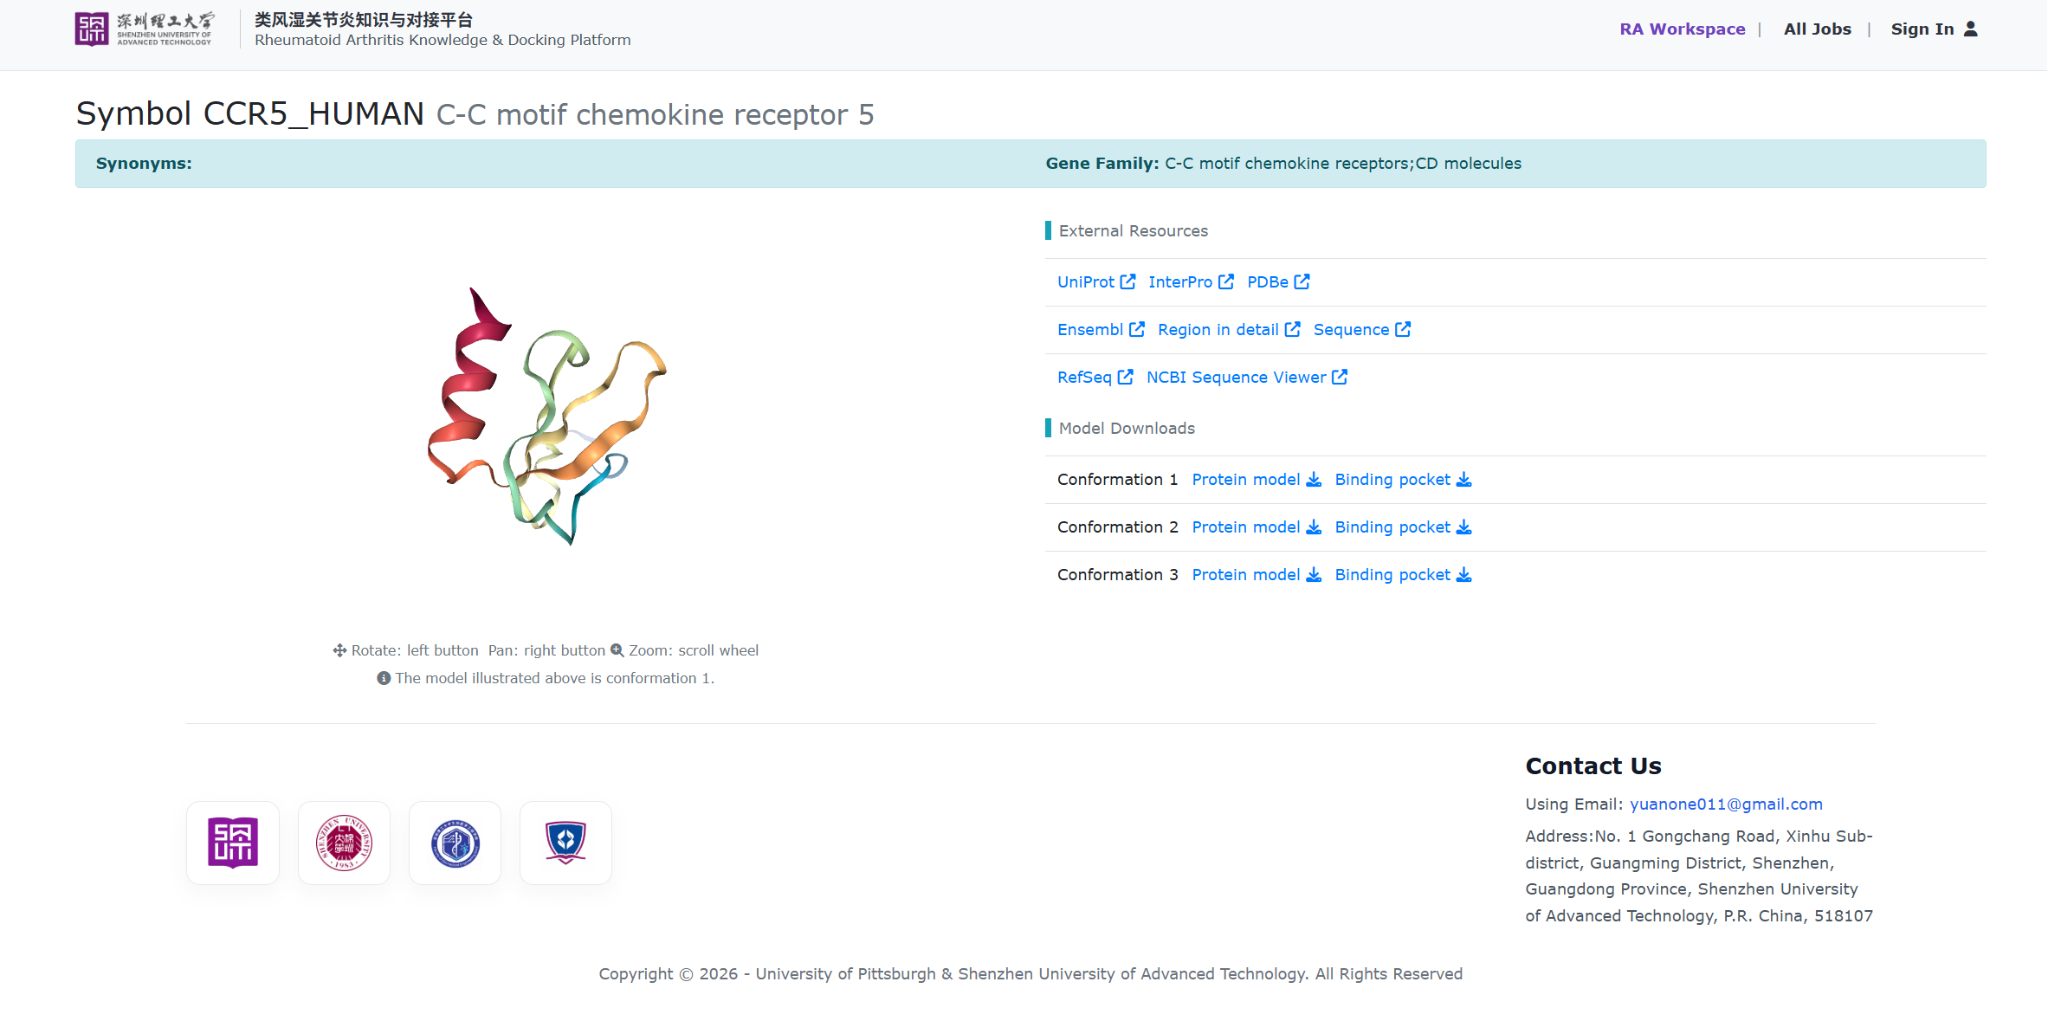
-
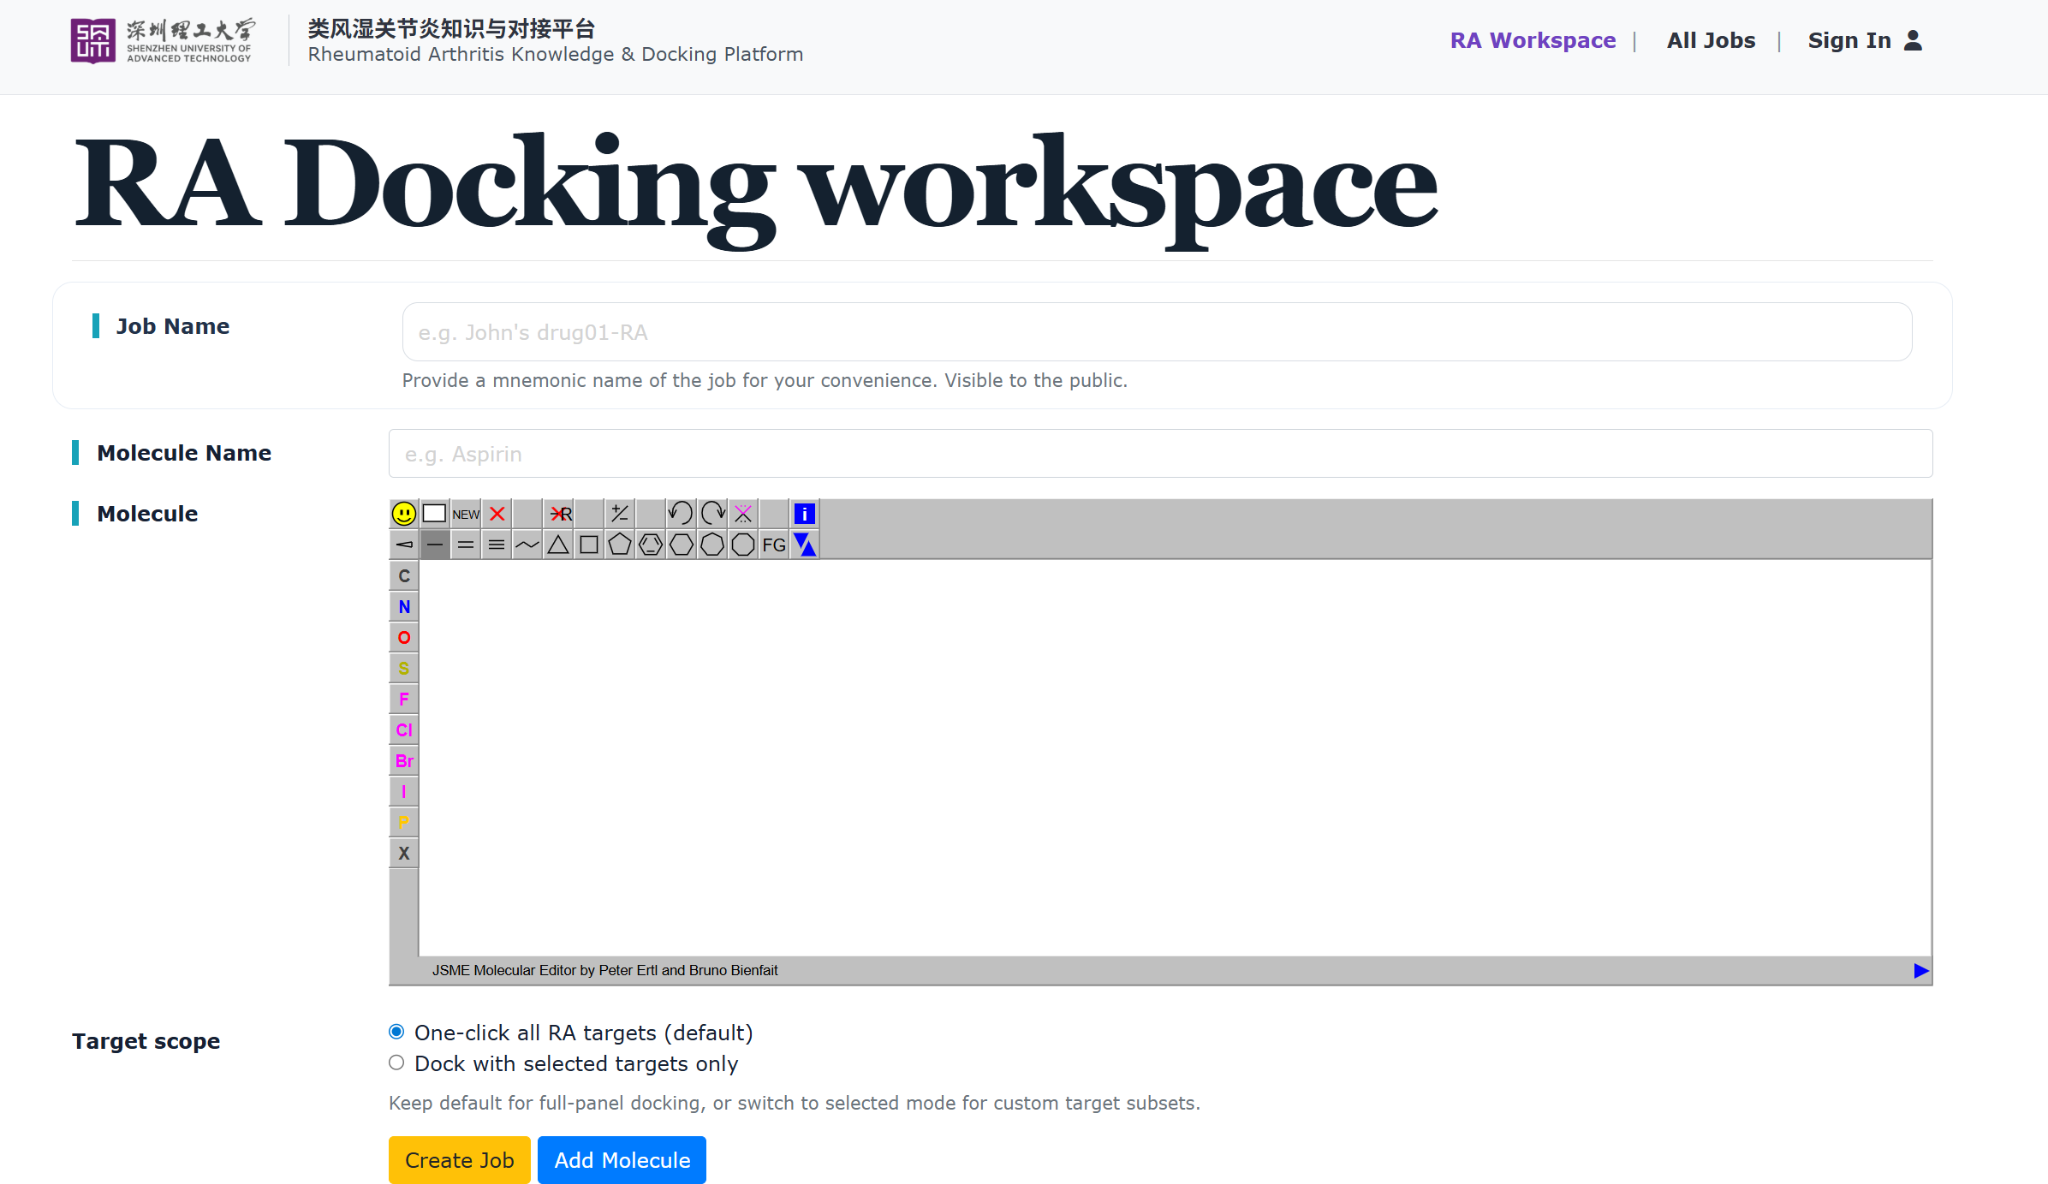
Step 1. Create a docking job.
Enter a Job Name, provide the Molecule Name, and draw or paste the molecule structure in the molecular editor. When the molecule is ready, proceed to target selection and job creation.
-
Step 2. Select the target scope.
You can keep the default option One-click all RA targets for full-panel docking, or switch to Dock with selected targets only and manually choose specific proteins. This allows you to focus the docking task on a custom target subset.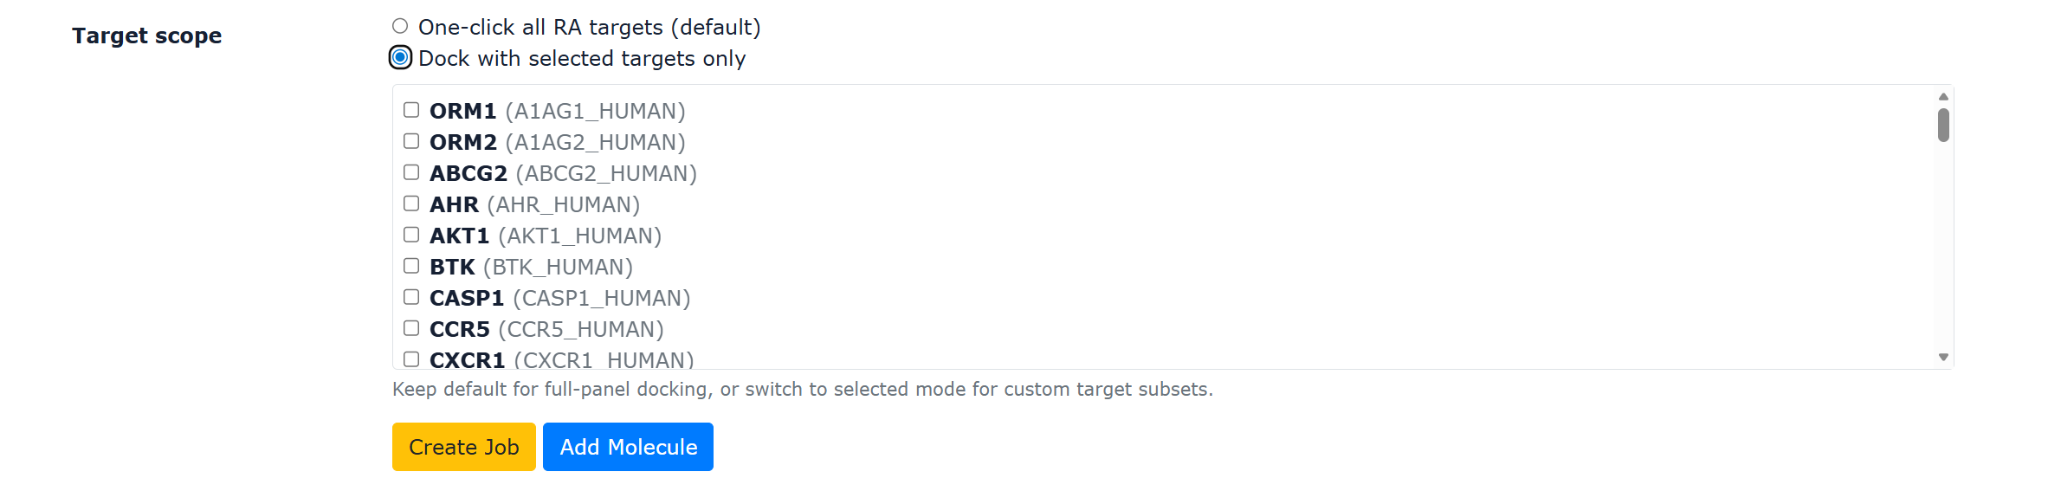
-
Step 3. Browse submitted jobs.
After a job is created, it appears in the docking job list. This page summarizes submitted jobs and displays their names, ligands, created and updated time, progress, status, and available actions.
-
Step 4. Search and filter jobs.
Use the search box and status filters to quickly locate a job by job name, job ID, or ligand name. You can also sort the list and switch between different job states such as running, finished, or failed.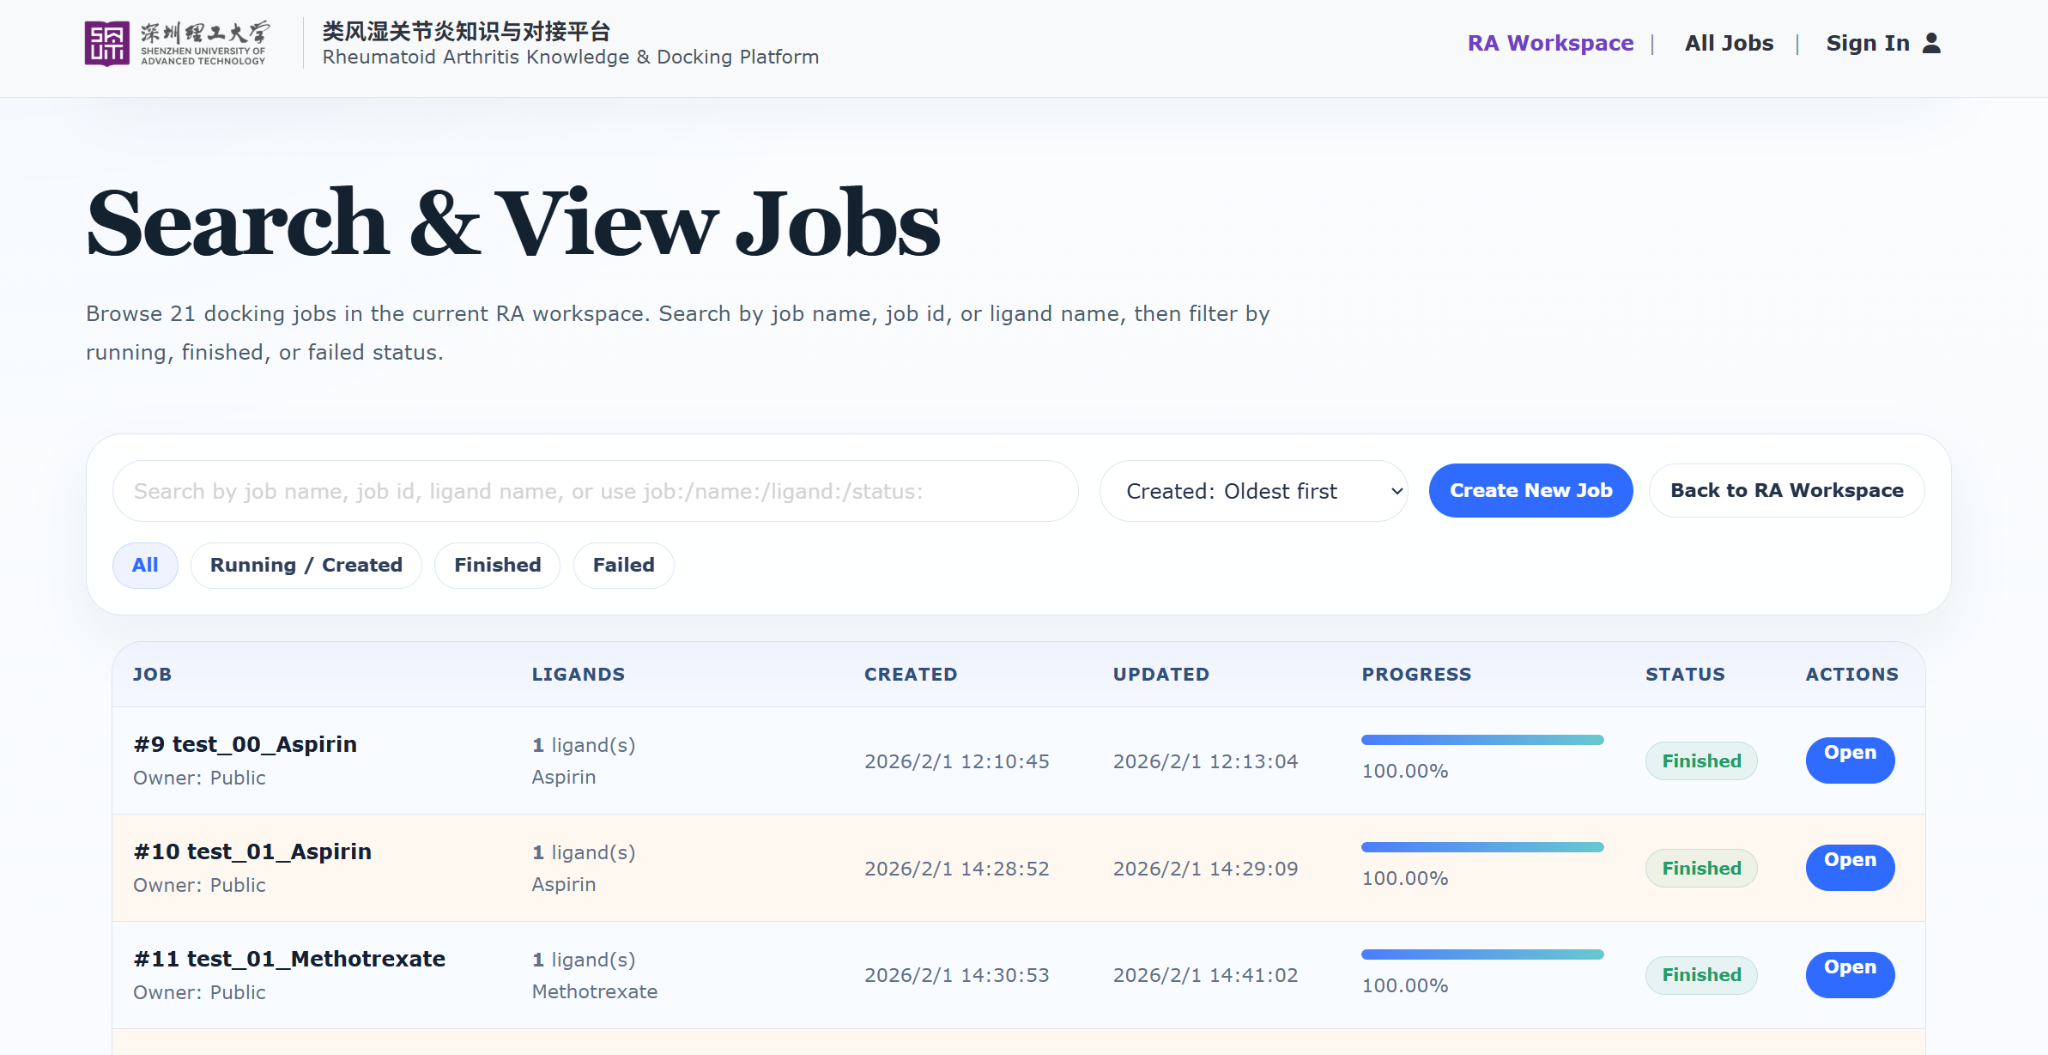
-
Step 5. Open a job.
Click Open in the job list to enter the job view page. Here you can confirm the job status, review ligand information, and access See Detailed Output, See Analytics, and Download CSV.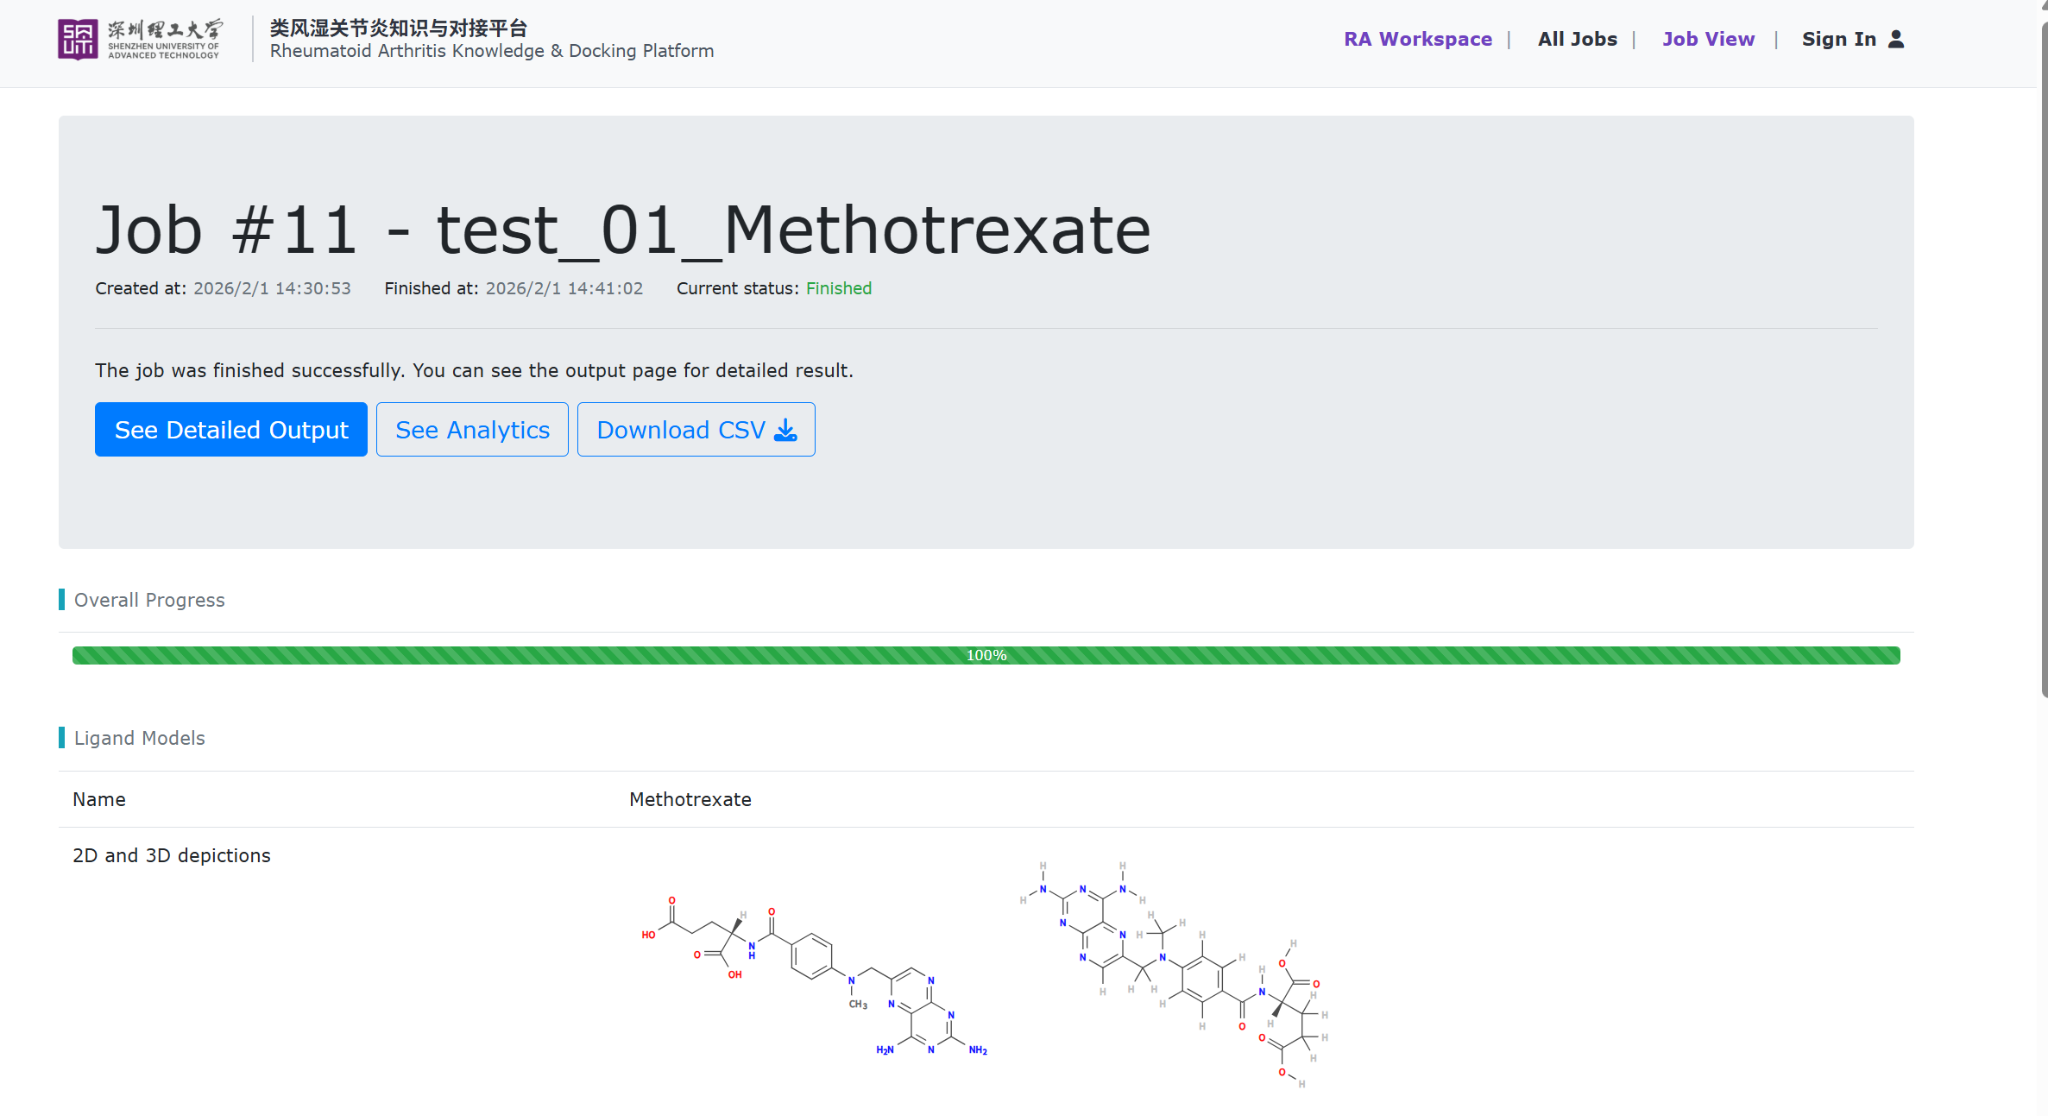
-
Step 6. View detailed output.
Click See Detailed Output to inspect docking results in table form. This page shows protein symbols, approved names, docking scores for each model, similarity scores, best-match references, and also supports CSV download.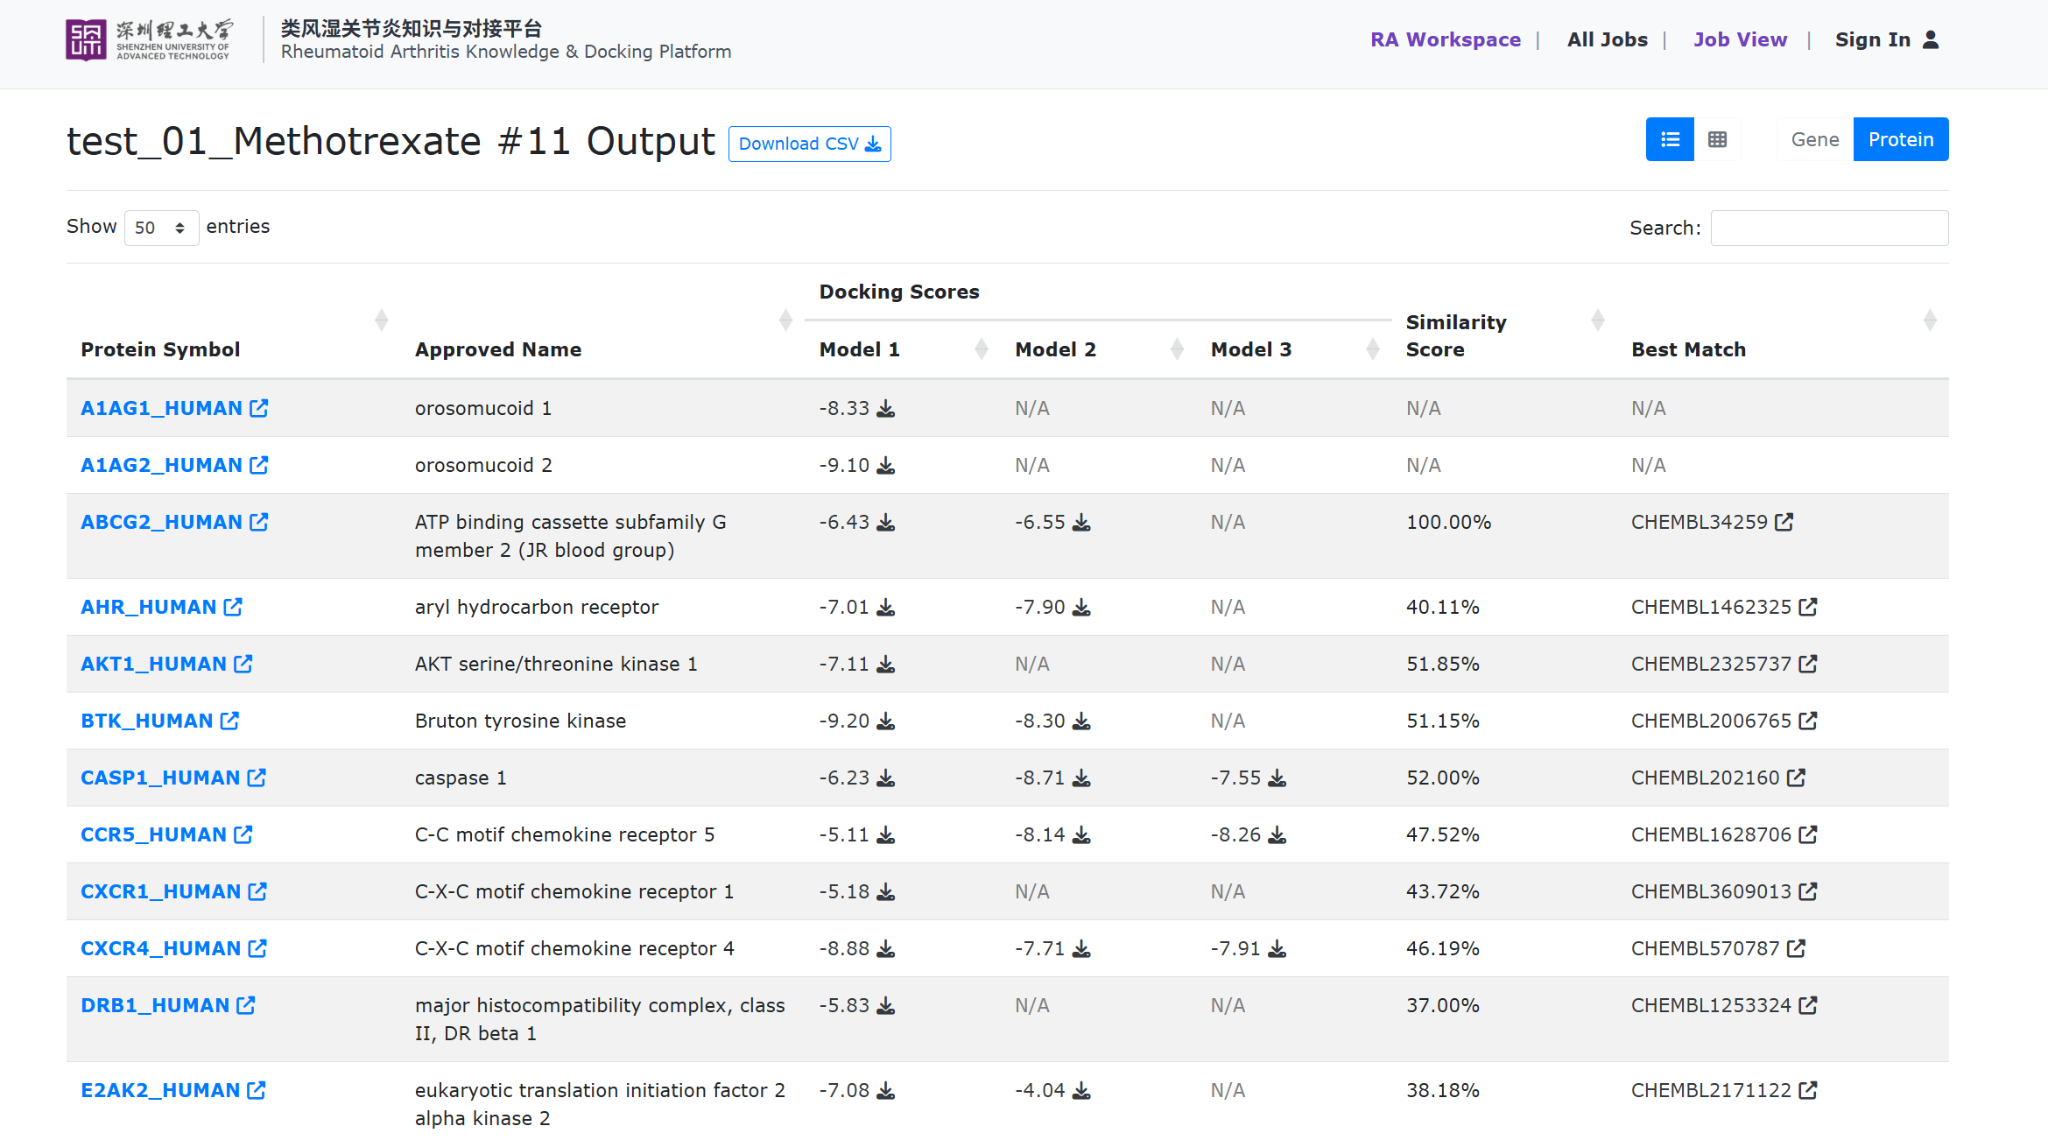
-
Step 7. Inspect analytics.
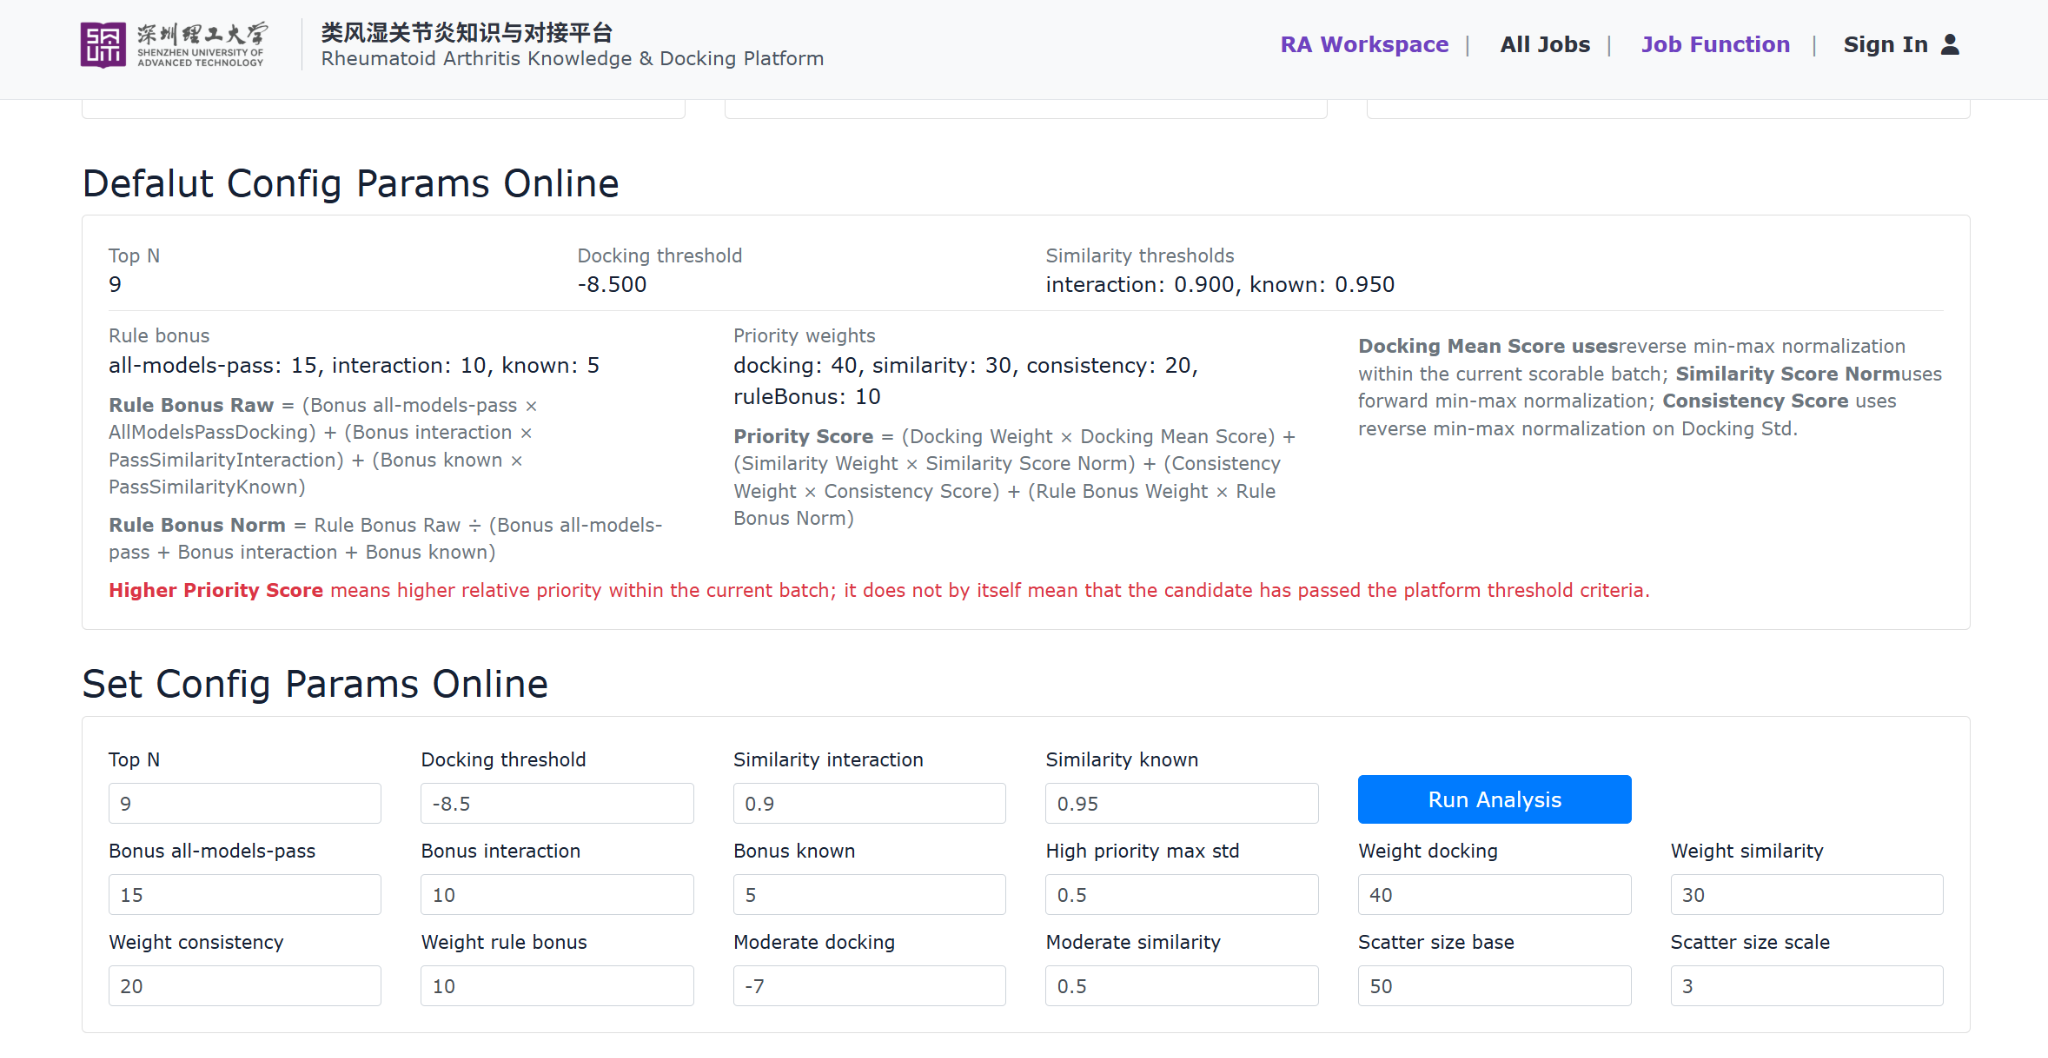
Click See Analytics to enter the analytics page. This section supports parameter adjustment, chart-based inspection, candidate ranking, grouped summaries, and downloadable analysis results.7.1 Configuration panel. Review the default parameters and adjust analysis settings such as Top N, docking threshold, similarity thresholds, bonus rules, and scoring weights before running the analysis again.
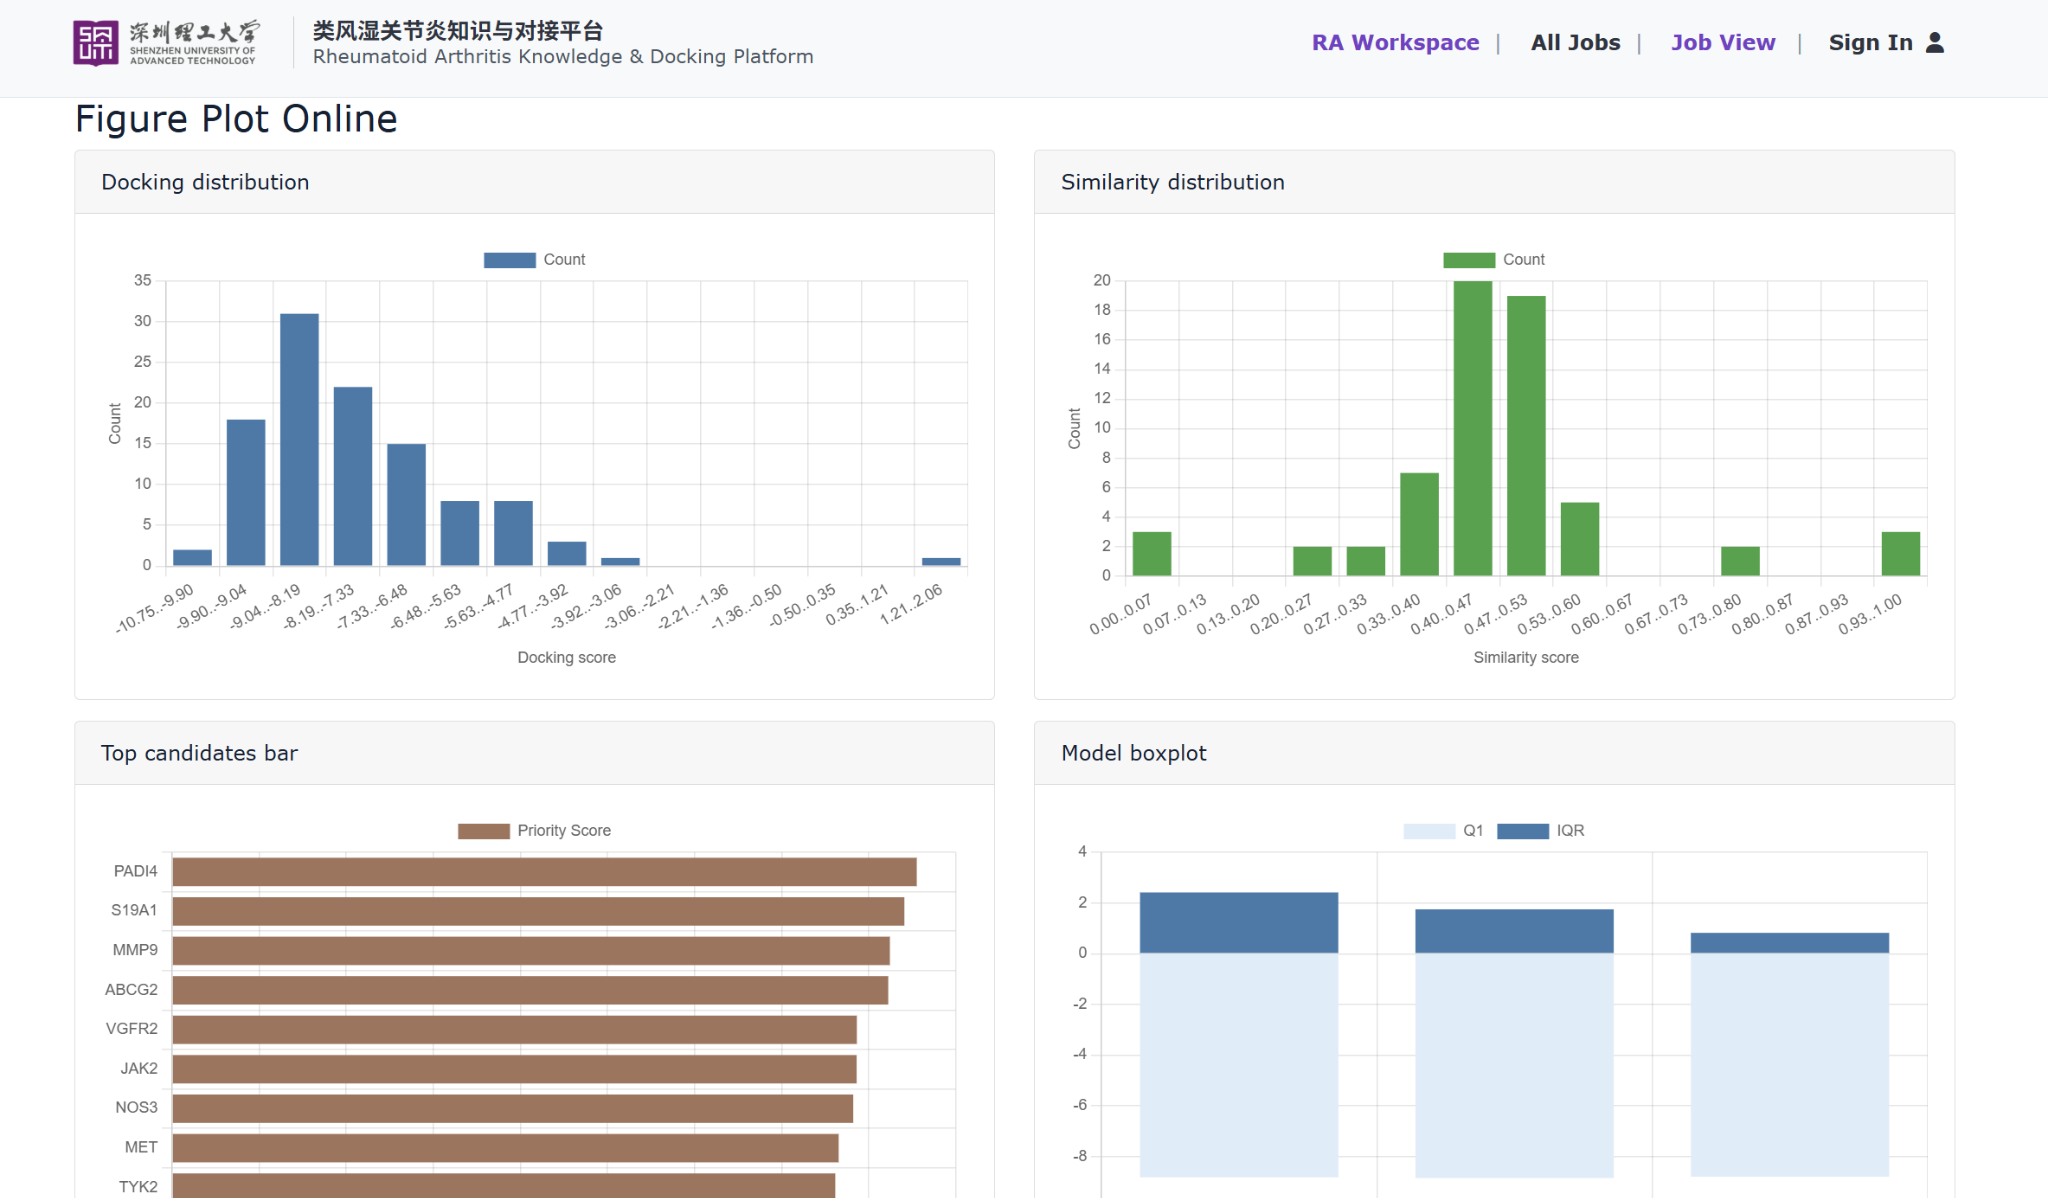
7.2 Distribution and ranking plots. These figures summarize docking score distribution, similarity distribution, top-candidate ranking, and model-level score spread.
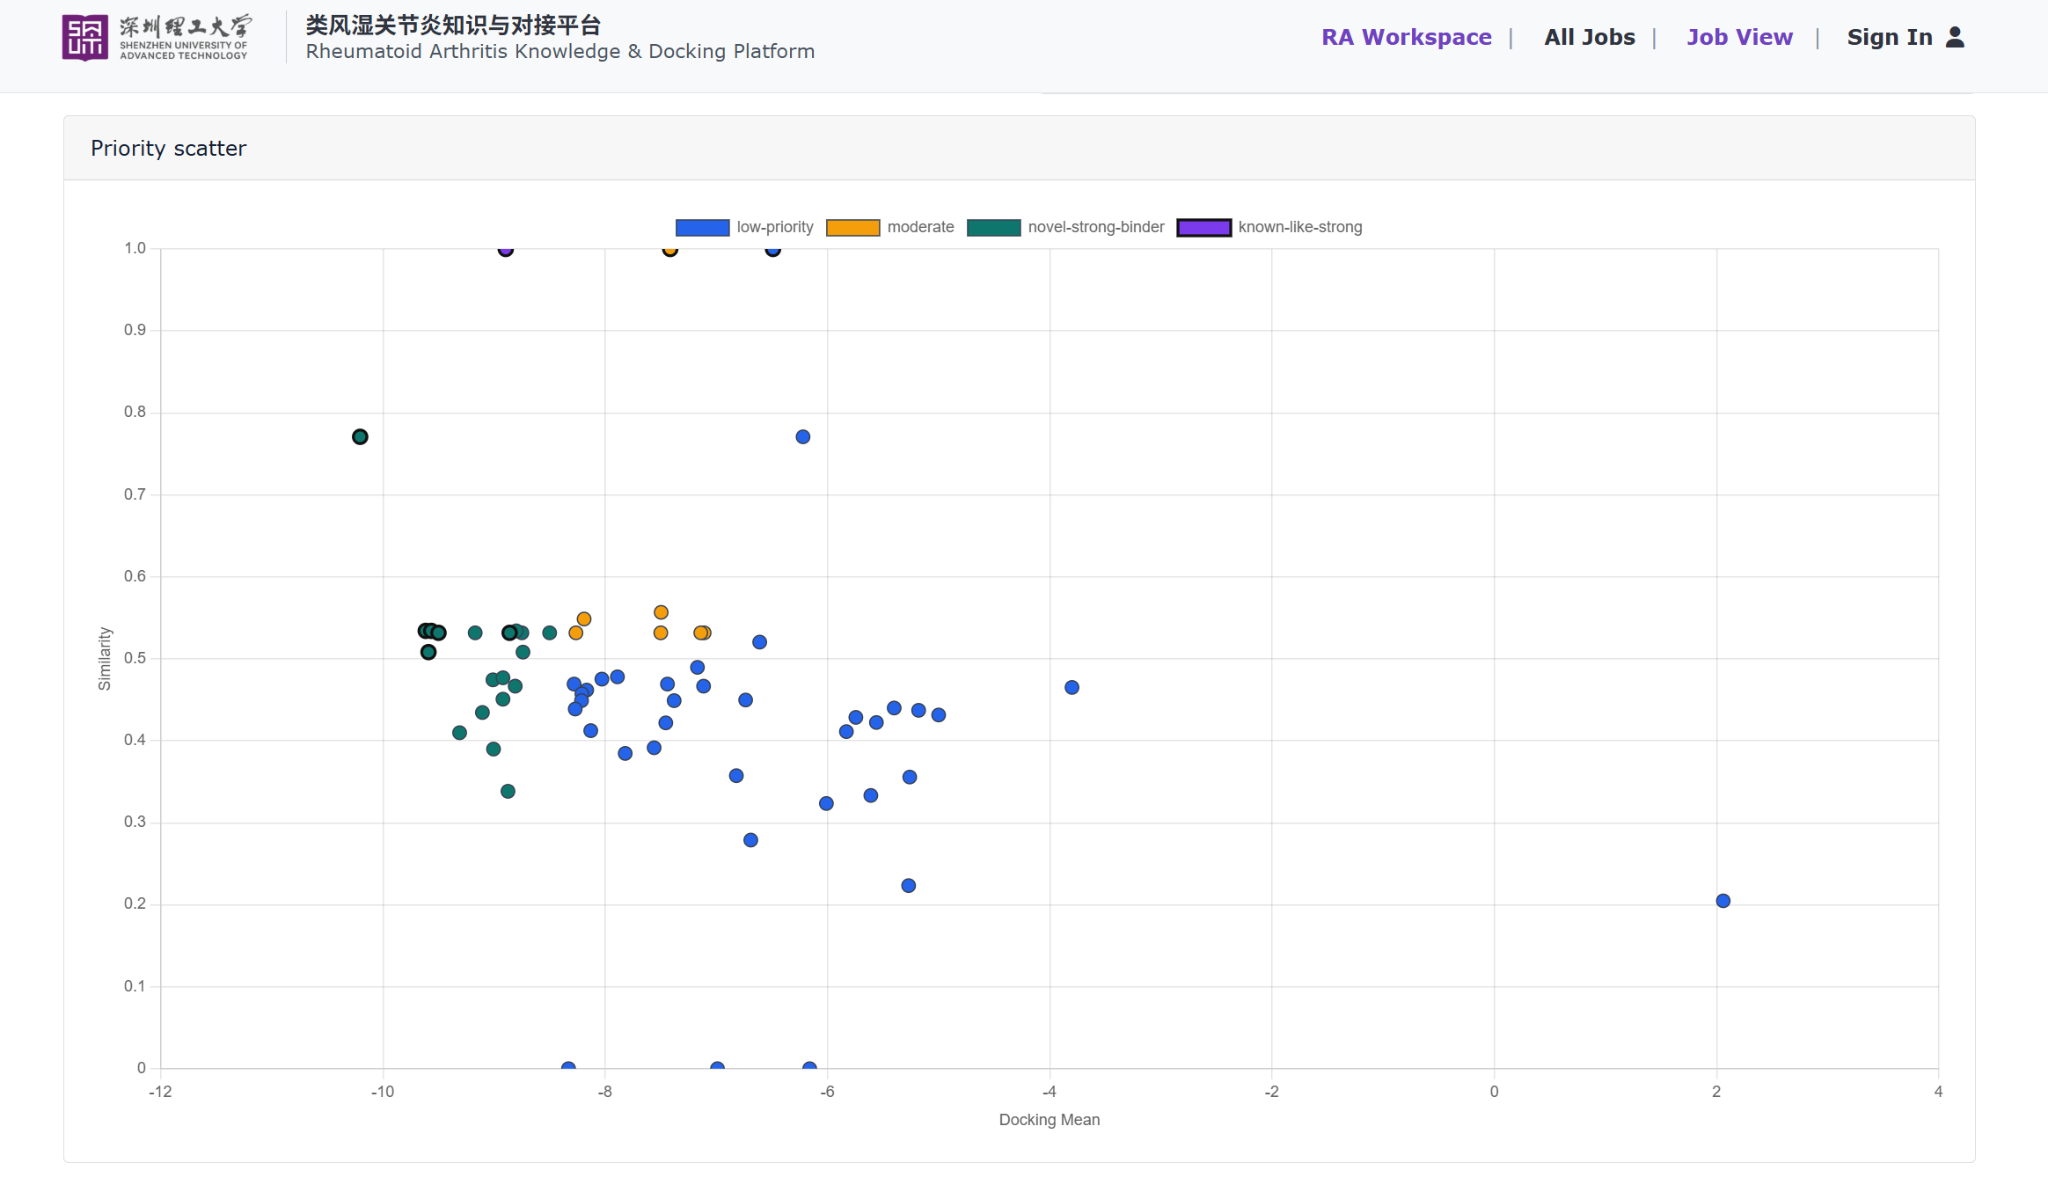
7.3 Priority scatter. The scatter plot compares docking mean and similarity values, helping users identify candidate classes and visually distinguish promising targets.
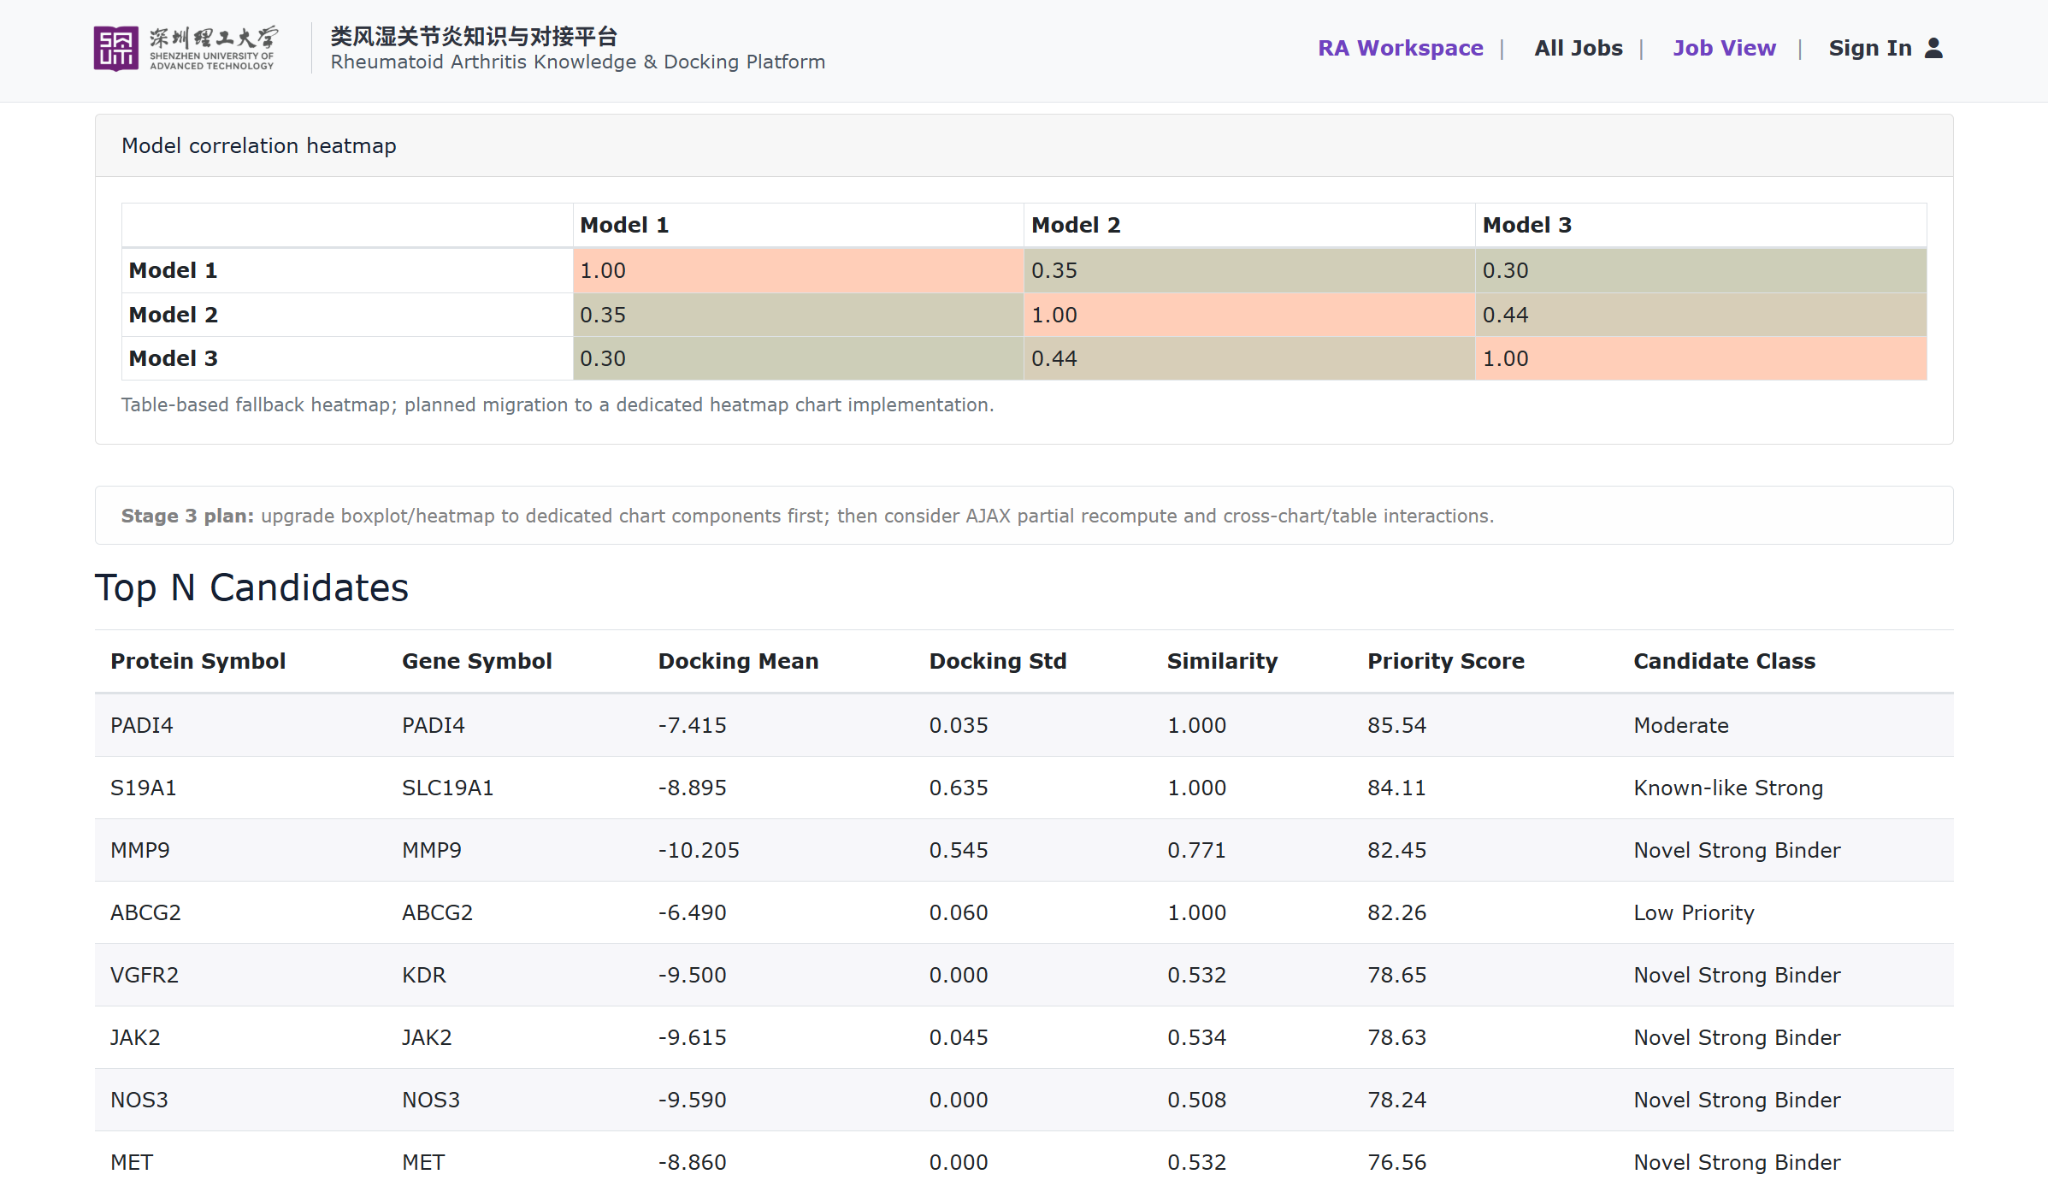
7.4 Correlation heatmap and Top N candidates. The heatmap summarizes consistency across models, while the Top N table lists candidate proteins or genes together with docking mean, docking standard deviation, similarity, priority score, and candidate class.
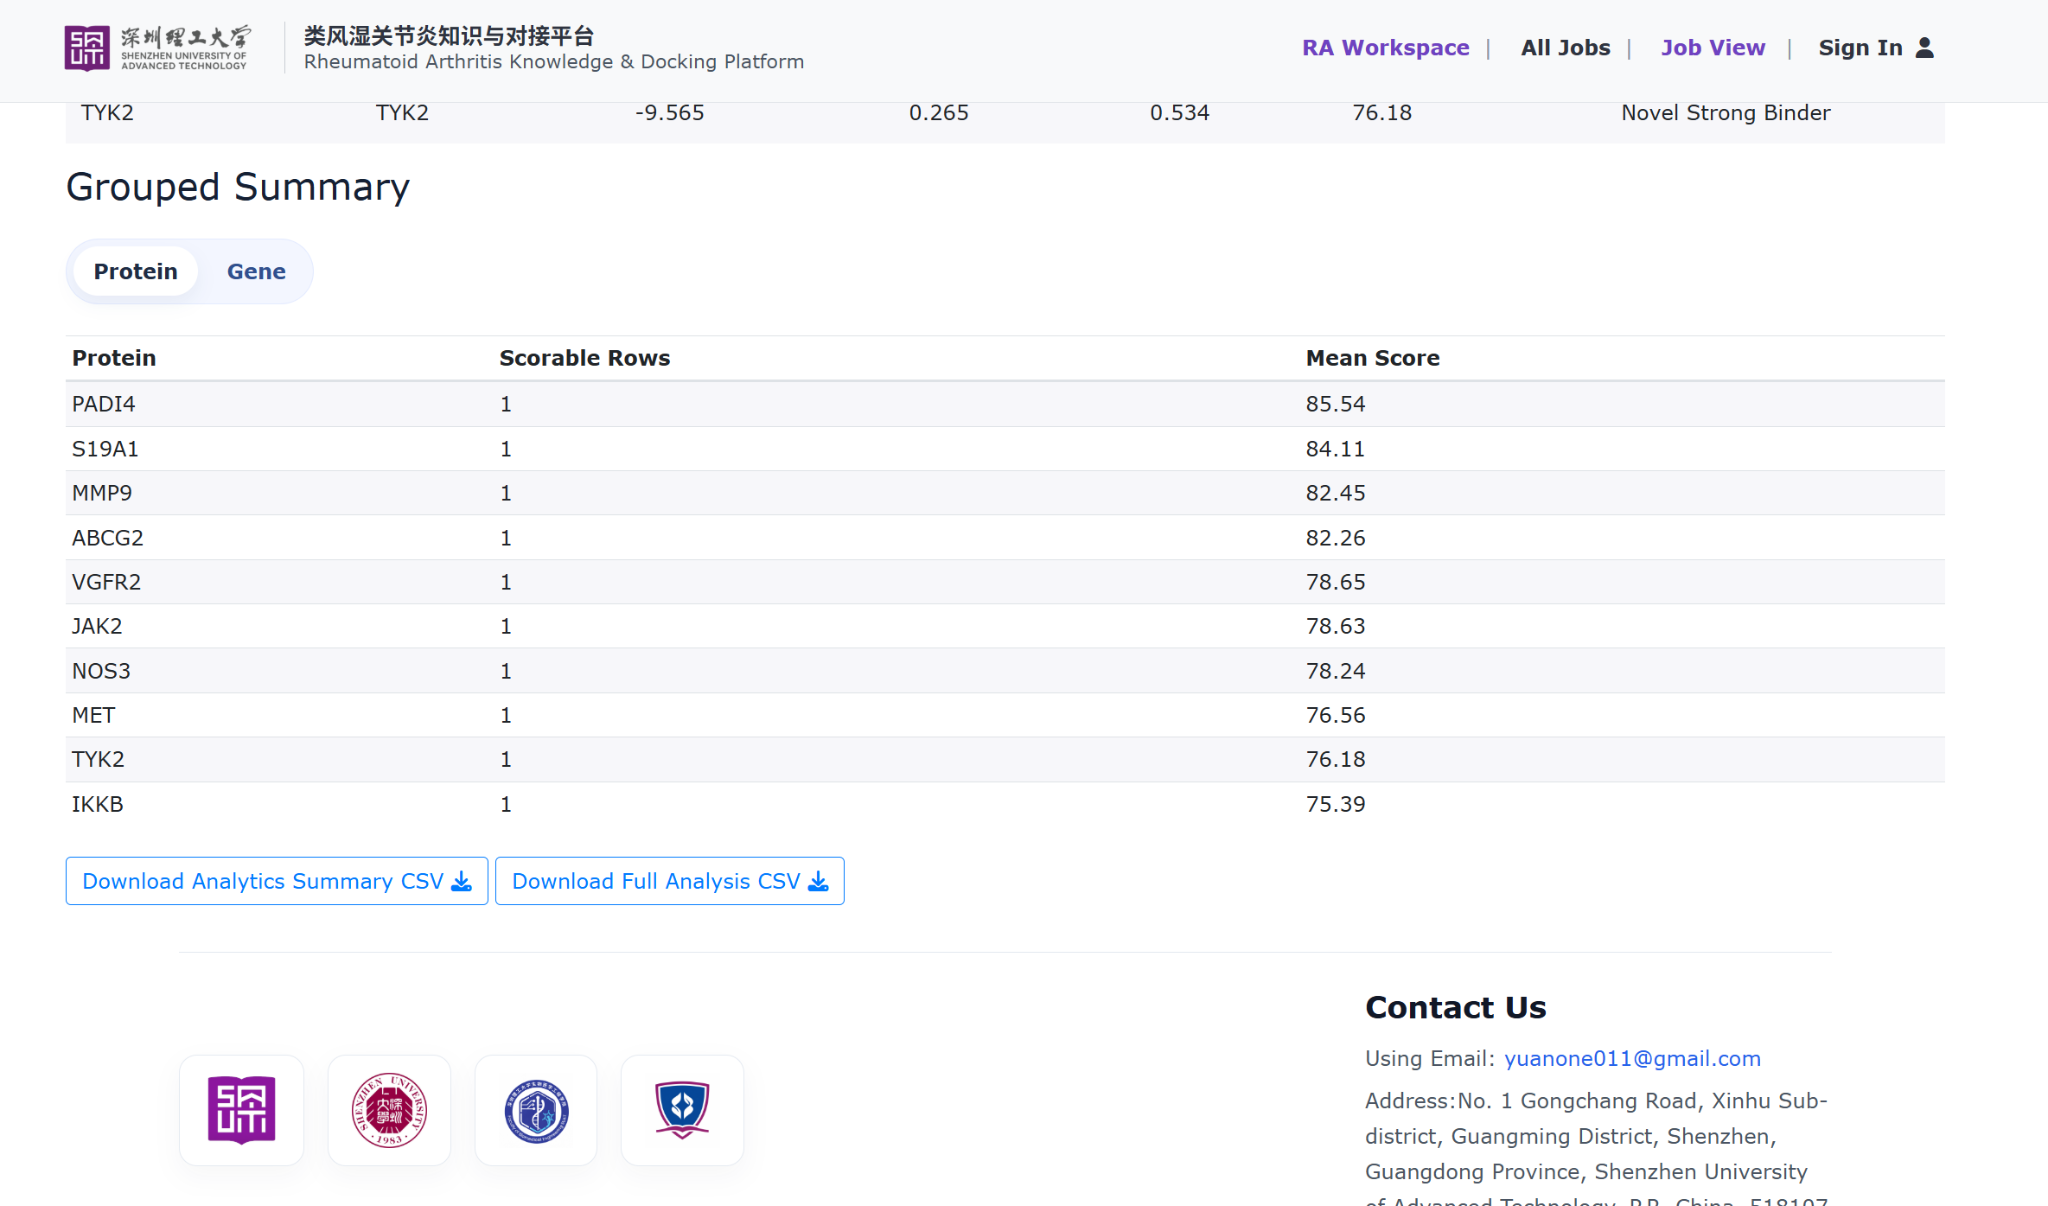
7.5 Grouped summary. The grouped summary aggregates the analysis results at the protein or gene level and provides export options for both summary and full analytics CSV files.
-
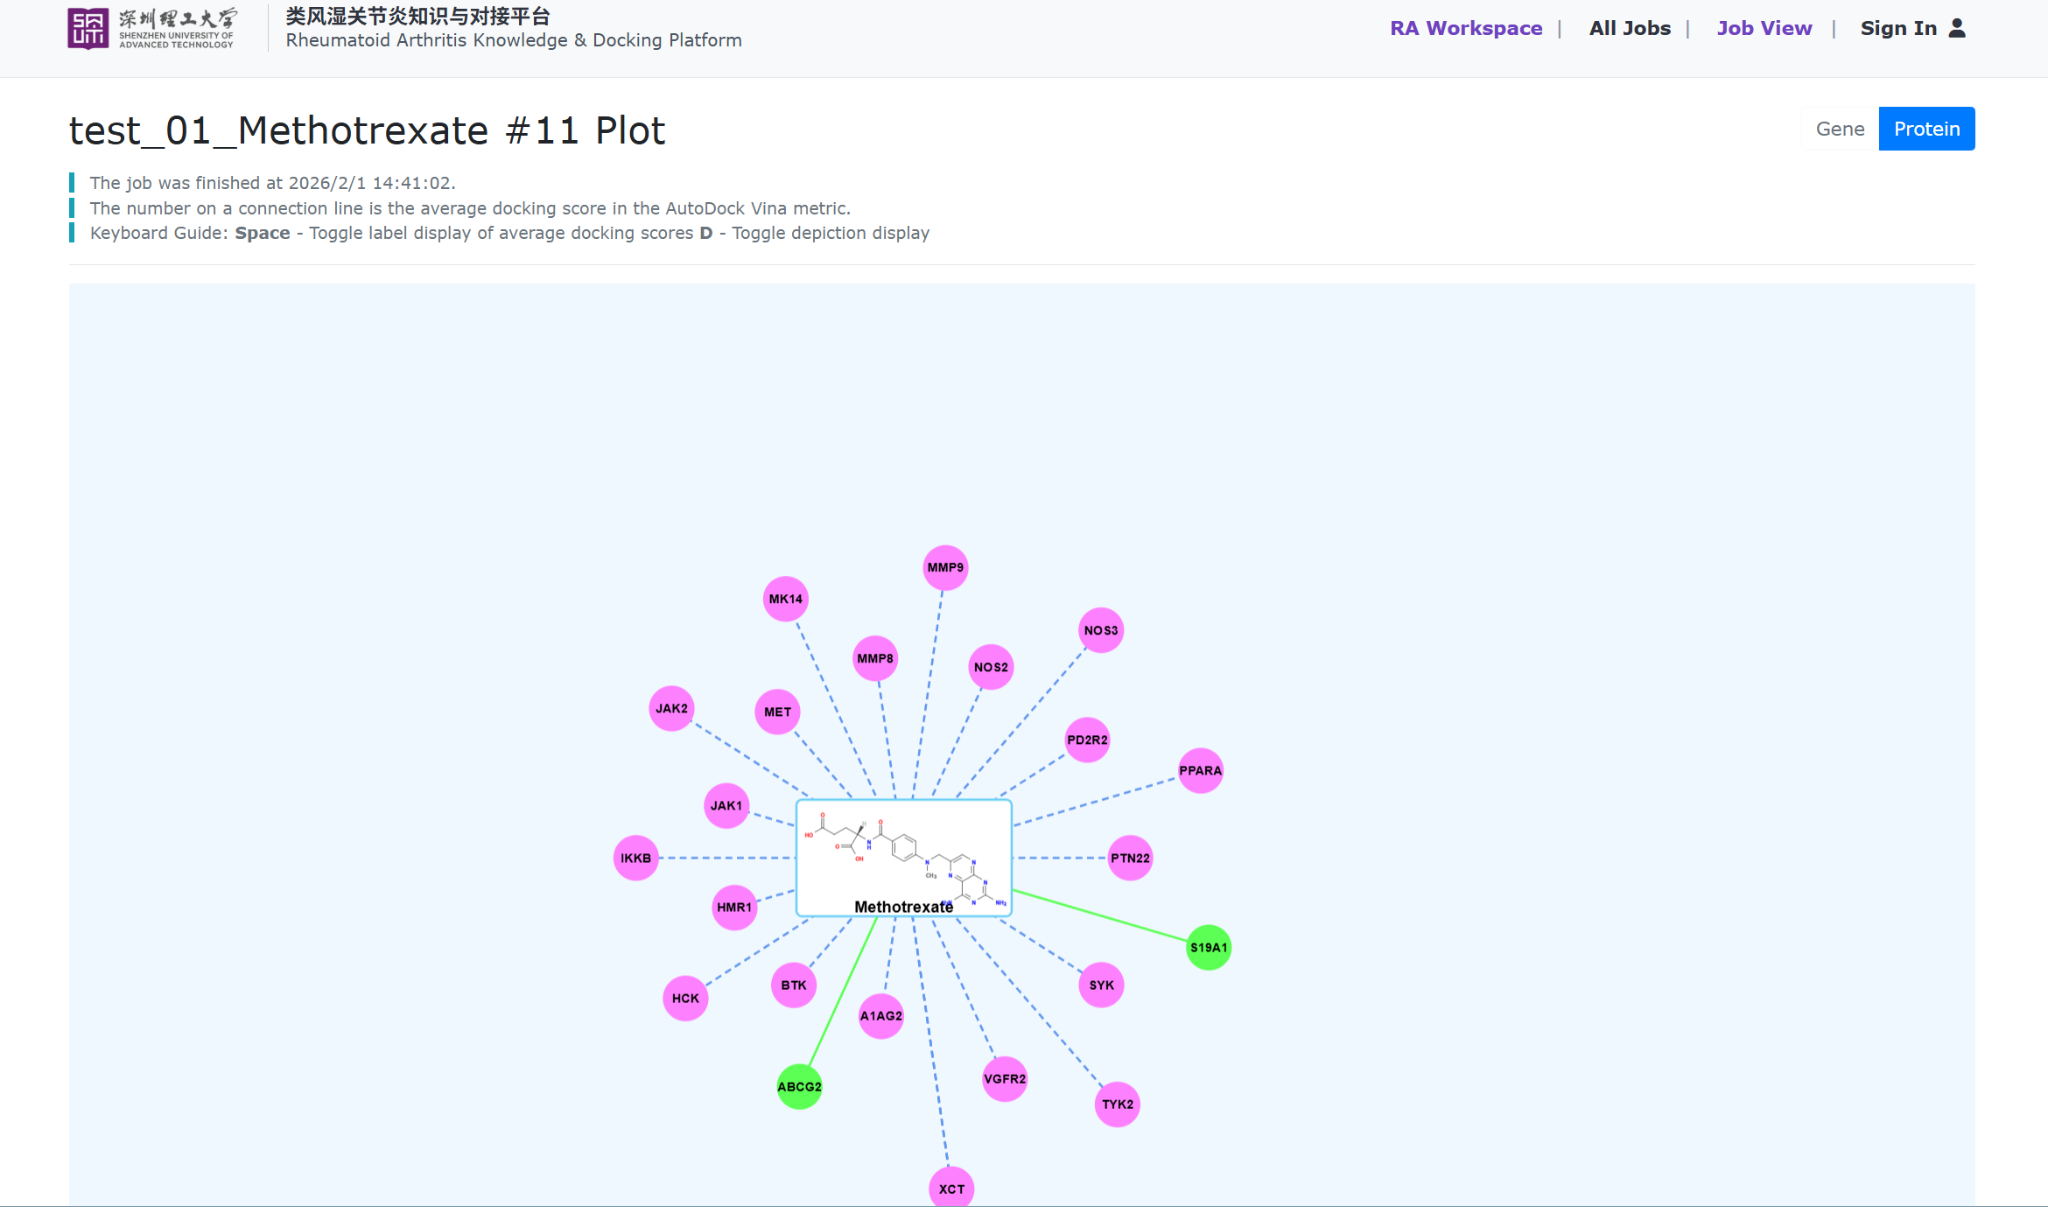
Step 8. Open the plot view.
The plot view displays the docking result as an interaction-style network centered on the molecule. It helps users visually inspect protein-level or gene-level relationships and understand docking connections more intuitively.